


Search
-
Increase Chart Rows Beyond 10?
 First post here and pretty new to the environment so apologies if I'm asking in the wrong place. The SQL Table Widget within the portal only shows 10 rows of a report by default, as does the chart filter grid that appears when you click on a chart group. Is there a simple way to increase this beyond 10 default rows?
 -
Re: Increase Chart Rows Beyond 10?

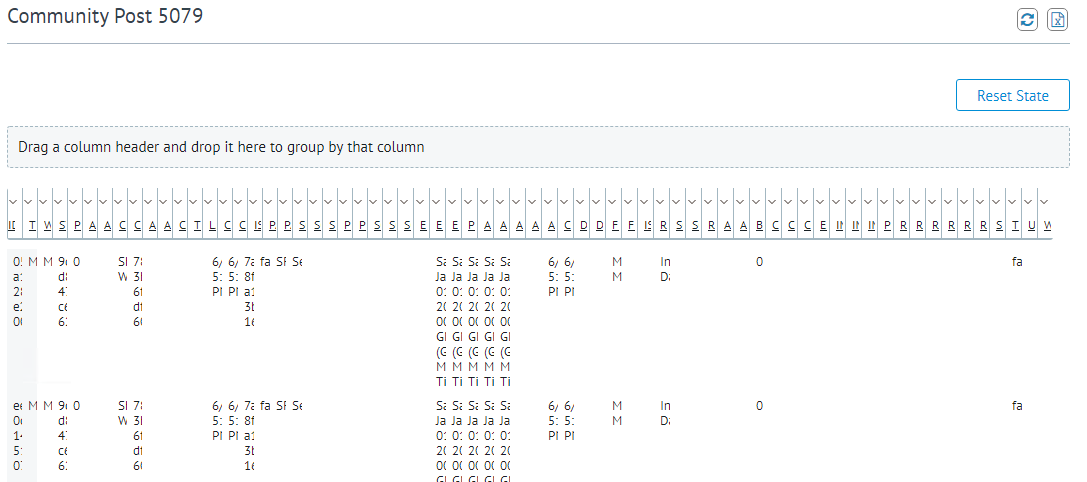 Hi @Martin_McNulty Which version of the Portal are you running? Below are 2 different scenarios, 1 SQL Table Widget with a SELECT * (All columns) function and 1 SQL Table where I have specifiec columns (more than 10), both display all rows and is not limited to 10: Thanks, Shane.
 -
Re: Increase Chart Rows Beyond 10?
 Hi @Shane_White , It's the row count rather than the column count. The SQL query doesn't limit the return at all. The default item count is set to 10 though, as below (excuse the red lines!): SQL Table Widget SQL Chart Widget (Columns, with 'Display Selected Item' enabled)
 -
Re: Increase Chart Rows Beyond 10?
I figured re-creating a custom version of the page is probably one way to go about it; I just wondered if there was an easy built-in method. That first image has a report where the number of rows is - and likely always will be - 11. So for it to default to 10 is unfortunate. Would be nice if it showed all 11 rows when… -
Re: Increase Chart Rows Beyond 10?
Hi @Martin_McNulty Ahh I see what you mean now! So I know you could probably do this with Javascript but one easier way might be quite simple once you change it once it will stay like that for all your current logged in user until your browser cache is cleared. Keeping it loading in 10 is better for performance especially…
5 results